Landslide Research, News, Research, Featured
Landslide Research, News, Research, Featured
Landslide Research, News, Research, Featured
Tips for Using the Landslide Risk Dashboard
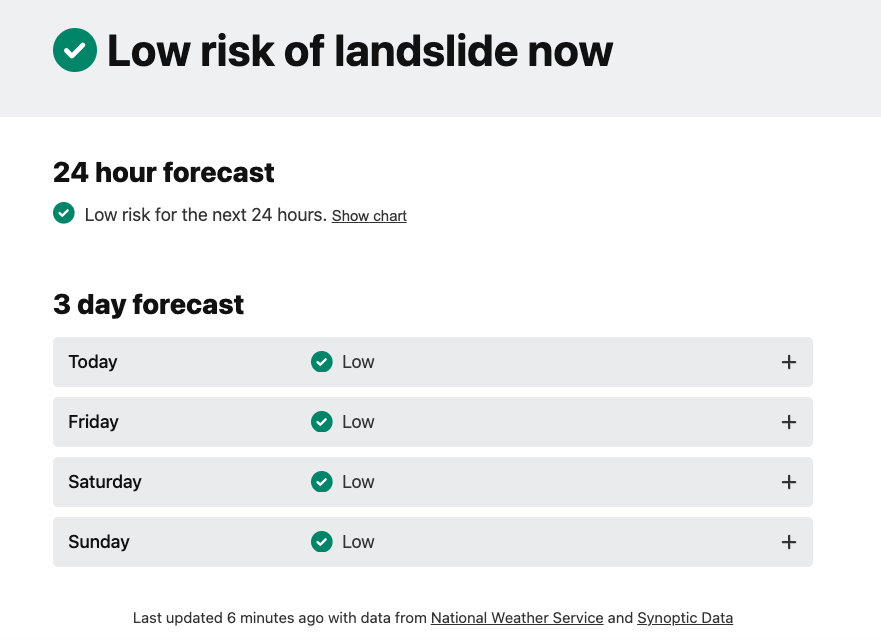
The landing page of the Landslide Risk Dashboard.
As autumn comes to Sitka, temperatures are dropping, and intense rain is back. While storms become more frequent and forceful, the risk of landslides also grows.
We hope that the Sitka community makes use of the resources available to assess hazards and make decisions for their safety — and we have some guidance for how to interpret these tools to make them even more effective.
Our Landslide Risk Dashboard was first proposed after 2015’s fatal landslide along Kramer Avenue.
“The Science Center and other people in the community [said], ‘We have to do whatever we can to keep this from happening again — to keep us from losing neighbors and loved ones and friends again,” says Luka Silva, Coastal Resilience Manager at the Science Center. “At the time, very little research had been done in Sitka for how to build some sort of tool that could reduce landslide risk.”
The Landslide Dashboard was launched in 2022. Researched and built over several years, it was refined by and designed in large part through feedback from community members and partners, including the Sitka Tribe of Alaska and many others.
Here’s how it works:
The Dashboard takes in two simultaneous streams of data: the forecasted amount of rainfall projected by the National Weather Service to fall over the next three days, and current rainfall levels observed at the Sitka airport rain gauge. It divides both collections of data into three-hour windows. It then assesses each window against past rainfall levels that have triggered landslides in Sitka, and assigns each time window a risk level based on how closely it mirrors those conditions.
Any weather and geohazard prediction tool, including this one, will contain uncertainty due to the sometimes unpredictable nature of the environment — however, there are steps you can take to make informed decisions based on data from previous landslides. Here are our tips on how to best use this tool.
- Don’t depend on the Dashboard alone
The Landslide Dashboard is not meant to be a singular resource, but rather one of many tools that should be used in combination with each other.
“The Dashboard tool is part of a series of decisions and resources that residents should be looking at,” says Silva.
Due to the inherent unpredictability of weather — and especially landslides — no single resource can be depended on infallibly. That means that the best approach anyone can take is to compare and combine multiple trustworthy sources of information, and weigh them all together when assessing safety.
Before checking the Landslide Dashboard, the first and most significant source of information that Sitkans should pair their Dashboard observations with is the Juneau Office of the National Weather Service, which includes a day-by-day forecast for Sitka, five-day regional outlook, and alerts for any noteworthy weather events (the NWS will make a note if they expect weather conditions may be intense enough to cause impacts like flooding or landslides).
“The Weather Service looks at a really holistic picture of what storms might be coming into the Southeast, what the conditions have been for the past few weeks, and what they’re expecting,” says Silva. “It’s real human people who are building these forecasts and using their incredible knowledge to do that.”
It’s also important to use local and individual knowledge — although these tools do their best to predict conditions, it’s ultimately you and your neighbors who are seeing the reality on the ground.
- Before referring to the Dashboard, check these resources
There are a series of questions and steps you should go through when assessing landslide risk — and checking the Landslide Dashboard is actually not the first.
- The first step you should take is simply relying on your own observations and asking yourself, “Is it raining hard?”
- If it is, check the National Weather Service first: if the forecast warns you that an atmospheric river or heavy storm is incoming, move to the Landslide Dashboard and check what the current risk level is.
- Keep the Landslide Dashboard open along with the National Weather Service. Monitor both to keep tabs on how rainfall and landslide risk are projected to continue and develop in the coming hours, paying particular attention to when rainfall will be heaviest. Continually refresh the Landslide Dashboard to ensure it updates.
- On the Landslide Dashboard, take a look at the Areas at Risk section to see what your exposure to landslide risk might be depending on where you expect to be in the coming hours. If you plan on going to work, visiting friends, staying home overnight, or traveling anywhere else locally, you should check and make sure these locations won’t be at a high risk level for landslide occurrence.
- If your home, school, or other location of importance is indeed in a highly susceptible location, and the National Weather Service and Landslide Dashboard are indicating a higher risk of landslide occurrence, then it’s time to turn to the How to Prepare for a Landslide menu.
Here, you’ll find a list of actions you can take to keep yourself and your loved ones as safe as possible.
These include:
- Tuning into local broadcasts;
- Following Emergency Management recommendations made during Public Service Announcements;
- Leaving high risk areas if it is safe to do so
There are also many steps that Sitkans can and should prepare on blue sky days, so that necessary resources are ready in case of sudden landslide risk. These include:
- Establishing a buddy system;
- Making an emergency plan for coworkers, neighbors, Seniors, and/or Disabled residents;
- Assembling an emergency “go bag”
It’s also important to remember that the Landslide Dashboard may not be applicable for assessing landslide risk outside of the Sitka area.
“Southeast Alaska is highly variable geologically, and rainfall varies across microclimates,” says Nick Mathews, Lead Geoscientist at the Science Center.
Although towns like Hoonah, Angoon, and Juneau may be relatively close together on a map, the impacts of storms and corresponding landslide risk can, and do, vary dramatically within the same region.
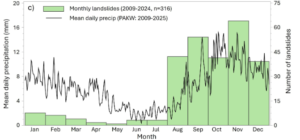
A graph from a recent paper demonstrating the correlation between heavy rainfall and landslide risk.
- Remember that the conditions that trigger landslides are highly uncertain
The Landslide Dashboard takes the best indicators available — rainfall patterns that have led to recent Sitka-area landslides — to predict landslide likelihood as accurately as possible. But although certain rainfall amounts can result in a landslide, that doesn’t mean they always will.
“A moderate or high forecast … corresponds to conditions that have caused a landslide, but it may not cause a landslide every time,” says Mathews. “This is a tool, but it’s not perfect. The conditions that trigger landslides are highly uncertain.”
In the face of these unknown variables, the Sitka Science team advises residents to always stay prepared for an emergency, rather than wait for one to be confirmed.
“We always recommend exercising an abundance of caution,” says Silva. “We hope this can be one of many tools that you use to make decisions, including the weather service forecasting, and your eyes and ears.”
- Interpret risk levels based on these parameters
The Landslide Dashboard’s risk levels are Low, Medium, and High; however, it is important to remember that the risk that these levels represent is a spectrum, and not one-size-fits all for each situation.
For instance, “Low” does not equate to zero risk, especially because slopes with man-made alterations like roads can behave erratically at lower rainfall amounts that wouldn’t pose as much of a danger to unaltered slopes. Because of this, heightened caution is recommended on or beneath altered slopes, even when the forecasted risk level is Low.
“This is a continuous variable that we have chosen thresholds for,” says Mathews.
Ultimately, interpreting risk level comes down to personal tolerance; put simply, the Dashboard levels are discrete categories, but real-life risk is a spectrum.
- Use all of the tools the Dashboard offers beyond the landing page
The main page of the Landslide Risk Dashboard is the first set of information Sitkans can use to assess risk, but there are many other equally useful sources included within the Dashboard’s sub menus, including oral histories with the Sitka Tribe of Alaska, outlets to report on-the-ground conditions to, and much more.
One of the most useful tools that users should make sure to view is the Current Risk Graph, which is accessed by clicking on the topmost header on the main dashboard page stating the current landslide risk (i.e. “Low,” “Medium” or “High” in large bold font).
This graph compares the current rainfall level (green dot) to past rainfall conditions that have triggered landslides (pink dots) and not triggered landslides (gray dots), providing a spectrum of risk that can help understand why current conditions are labeled at the risk level they are.
“I think it gives you context that other bits of the dashboard don’t necessarily give,” says Silva. “It lets you peek under the hood in a way that I think is really helpful.”
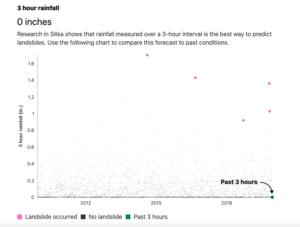
The Current Risk Graph.
It’s also important to remember an immediate tool at your disposal: your own instincts and observations of the environment around you.
“A visual cue to keep an eye out for are typically clear streams running brown or discolored during heavy rainfall,” notes Silva.
As Sitka enters the rainiest time of year, we hope that you will use the Landslide Dashboard to assess your own and your loved ones’ safety regarding landslides — and that this guidance helps you use this tool to its highest capacity.
We are eager to learn about Sitkans’ experience interacting with the Landslide Dashboard. If you have questions or feedback, please reach out to landslides@sitkascience.org.