Landslide Research, News, Research
Landslide Research, News, Research
Landslide Research, News, Research
Landslide Research Recapped: Lessons Learned and Next Steps Forward
Year in Review
We have just begun the second year of the landslide warning system design, and many of you are aware that the research team was recently in town conducting a variety of workshops, informal events, and meetings. This article will start with an overview of what the warning system design has brought Sitka so far, then share how insight from Sitkans is used in planning by the research team, with emphasis on the importance of community participation. We will specifically address two exciting developments: new sensors for landslide warning and a second co-design workshop to further develop the design of the warning system. There’s a lot to share about this recent visit, so buckle up for an informative post!
New Sensors
Five new stations that monitor environmental conditions related to landslides came to Sitka between June 2019 and now! Three newly designed low-cost soil moisture sensors, installed that June, found their homes on Harbor Mountain, Gavan Hill, and Mount Verstovia. In September, the USGS installed a more traditional, higher-cost station was installed near one of the low-cost sites with intentions of comparing data from the low-cost design, ensuring data quality. It also makes Sitka one of the USGS’s few monitoring locations, deepening their understanding of conditions that cause landslides. Also, geologists from the state erected a meteorological station at over 2000 ft, bringing high elevation weather monitoring capabilities to Sitka for the first time. These new data streams will be used in conjunction with pre-existing data streams from locations such as the airport to see how rain varies with elevation and how soils respond to these types of landslide triggering conditions. The National Weather Service and project team can use these data streams to improve landslide warnings.
Below is an example of how this data can be used in aggregate to understand landsliding conditions. It shows soil moisture (red) and pore pressure (gray) at the low-cost Harbor Mountain sensor site with hourly precipitation recorded at the airport near the end of August, 2019. This data set provides two examples of how soil moisture responded to two small/moderate rain storms. No landslides occurred in Sitka during these storms, which helps the team determine an initial threshold of rain intensity needed to initiate a landslide.
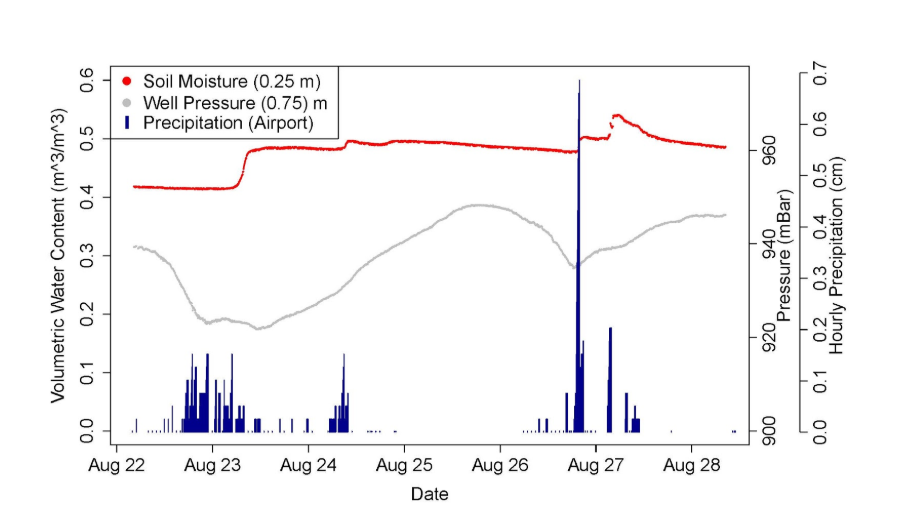
Figure 1: Soil moisture (red), well pressure (gray) and precipitation (blue) from Aug 22-28. Soil moisture and well pressure are from the low-cost stations, and precipitation is from Sitka airport.
Maintaining these stations on our steep slopes with the wildlife and weather conditions present in Sitka proved to be more challenging than anticipated. The low-cost stations had some trouble with batteries, not being quite water-tight enough, and rain gauges becoming clogged with pine needles. This unusually snowy year buried the high elevation weather station. The USGS station suddenly stopped reporting in mid-December due to a bear-related incident. But what is science without a few lessons to learn from? A plan is now in place for local maintenance of the sensor network and measures are being taken to ensure that each sensor system can take on the environment of Southeast Alaska. We look forward to remedying these issues this spring and installing Version 2 of the low-cost stations this summer. Stay tuned for updates.
Co-Design Workshop
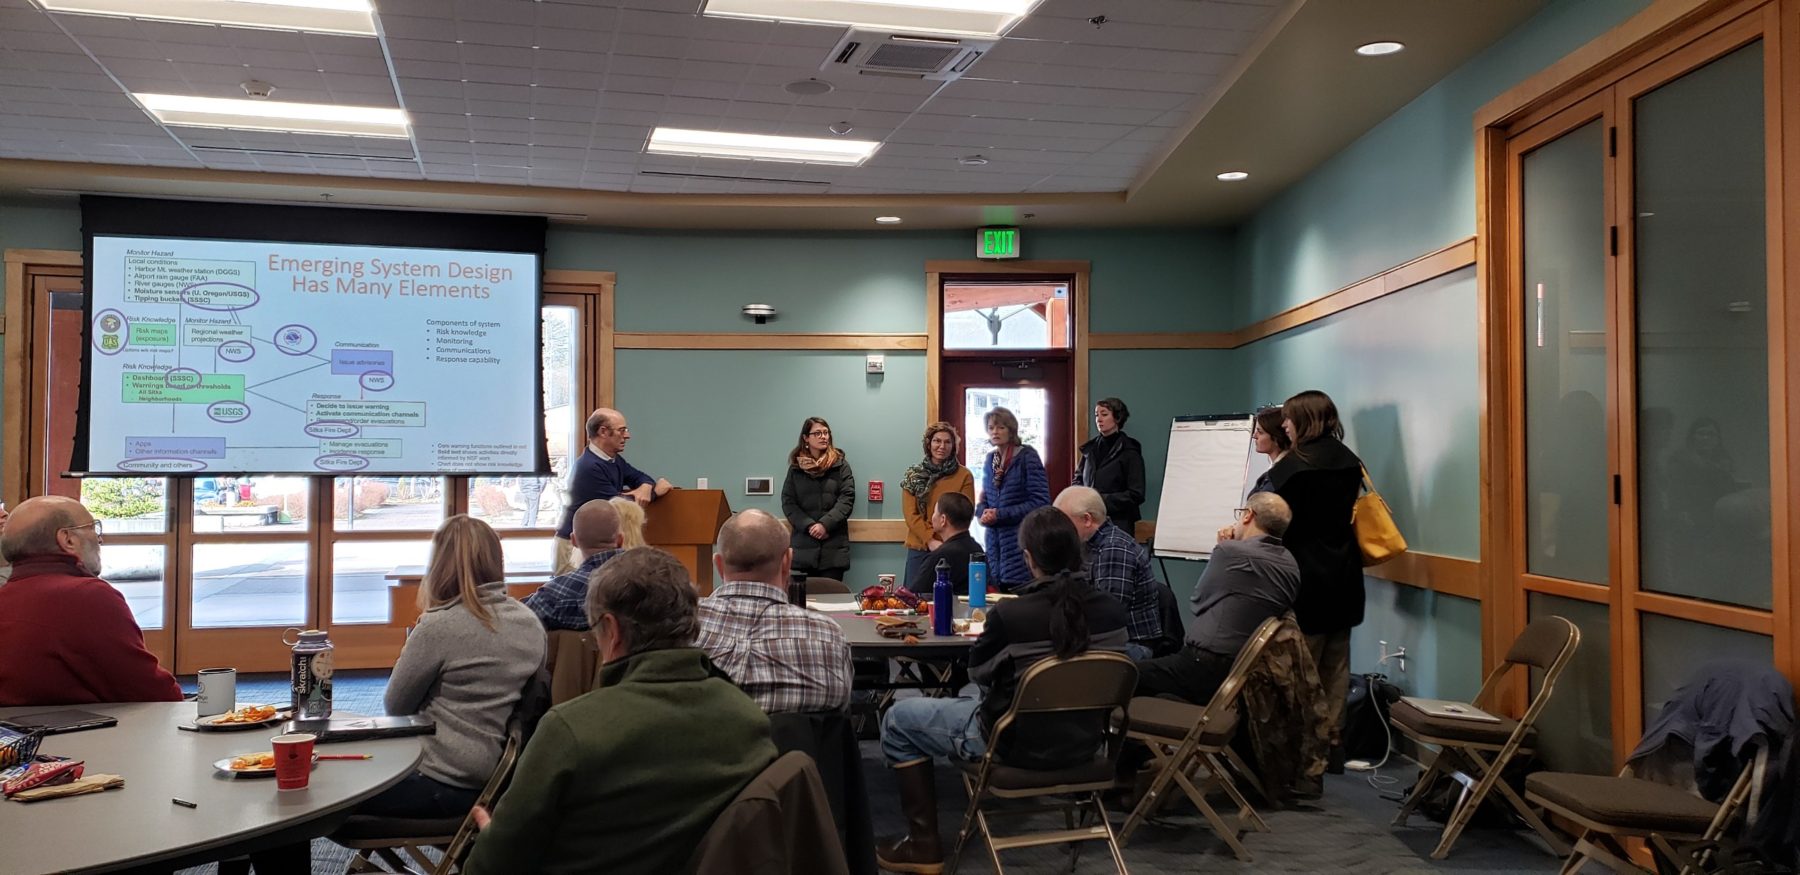
On Feb 19, Sitka Sound Science Center (SSSC) hosted a landslide warning system co-design workshop with community members and its research partners from RAND Corporation and the University of Oregon. The workshop provided an update to bring all participants up to speed, then engaged participants in two crucial topics: thresholds for the warning system and gathering social network data to improve risk communication.
Geoscience
No warning system is perfect, and there will always be some false warnings (a warning is issued, but no landslide occurs) and failed warnings (no warning issued, landslide occurs). These tradeoffs become defined when we develop a threshold, an important step in the design of Sitka’s landslide warning system. Check out our last blog post for a more in-depth discussion on risk, effective warning systems, and inherent tradeoffs.
The workshop included a “serious game” to help participants engage with this question. During this game, participants were given a plot (Figure 2) that shows maximum precipitation intensity for storms that initiated landslides in Southeast Alaska in the last decade (black triangles) compared with storms that did not initiate landslides (open circles). Five landslide-initiating storms are each represented three times, with points that represent the maximum one-hour, three-hour, and six-hour intensities. The “landslide” data comes from historical weather data recorded near landslides that occurred in Southeast Alaska in the last decade, the “no landslide” data comes from precipitation records at the Sitka Airport on days that no landslide occurred.
Participants were asked to draw a threshold they thought would be reasonable for activating a landslide warning system in Sitka. They quickly recognized that to trigger a warning before all storms, some “no landslide” storms would also trigger the warning. In the opposite case, to prevent false warnings, some landslides in the data set would have occurred without a warning.
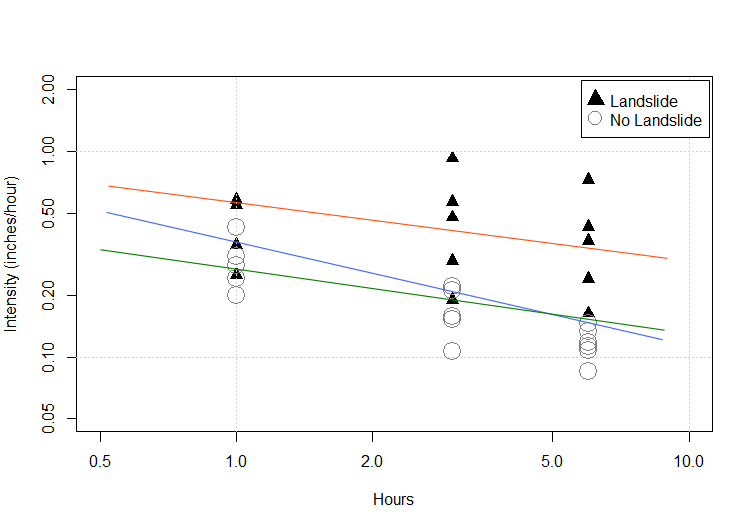
Figure 2: Plot that shows five landslide-initiating storms and five not-landslide-initiating storms shown at three different hour intensities. Red line indicates a risk tolerant example threshold, while the blue and green lines demonstrate more risk averse example thresholds.
Most of our workshop goers were risk averse or had a moderate tolerance for risk–their lines looked like the green or blue lines above. Only four or five individuals drew risk tolerant thresholds like the orange line above. Many people hesitated to draw a threshold because they didn’t have enough data. “What kind of soil was it?” and “how much had it rained beforehand?” were among the many questions raised throughout the activity.That was one of our first clues to an impactful lesson: the Sitka community has an appetite for data. Moving forward, the project team is exploring their options to make sure the community has access to data that can answer their questions, such as that shown in Figure 1 and more.
Improving Risk Communications
Information is less effective if it doesn’t reach the people who need to receive it and if the recipients don’t understand the material. A “social network” is a network of people connected through their relationships, and the landslide research team will use what is called “social network analysis” to work with Sitkans to improve the way risk information travels through the community.
Alongside the threshold game, the workshop included another game in which participants learned how researchers gather data on social networks. Participants were asked to name one workshop participant in the room (or themselves) who they would trust to take them clothing shopping in Sitka. The results of the survey were quickly input to a program that provided the resulting social network map (Figure 3). Here is the anonymized version:
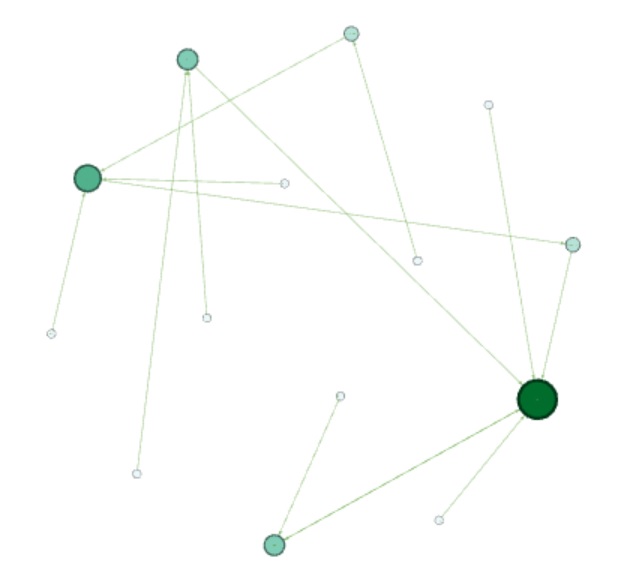
Figure 3: Anonymized social network map that shows who trusts who to take them shopping. Green circles, or nodes, represent workshop participants. The largest, darkest nodes were trusted by the most people, and the lightest, smallest nodes were trusted by the least number of people.
To a few peoples’ surprise, some participants were more trusted for their fashion senses than others! It is important to note that there are individuals on the map who are less connected to others. In this scenario, these individuals are less likely to receive fashion advice (though they might need it), or in other words, are a bit socially isolated. This game demonstrated how social network analysis could help the project team and Sitkans work together to ensure that everyone is able to adequately receive landslide warning information from various sources. Additionally, it gave participants a sneak preview of the types of questions researchers may ask community members when social scientists come to town.
Through discussions about the game, it became clear that Sitkans have a desire to increase their connectedness and begin mapping out their social networks so the maximum amount of information reaches the maximum number of people. Sitkans already have experience with using emergency alerts (ie phone trees), and we want to build upon this experience to create networks that can expand on these options in future emergencies to make sure that everyone is covered.
What’s Next?
Through the workshop and community conversations, the project team noticed that Sitkans seem to converge on a similar desire: to make their own decisions regarding landslide risk. The project team is pursuing additional funding to bring this option to the community via a digital dashboard. Such a dashboard would take all data streams associated with landslide prediction and display it in a digestible, interpretable way. Want to make sure your voice is heard when considering these options? Feel free to reach out to Geoscience Coordinator Cora Siebert at csiebert@sitkascience.org with any thoughts you’d like to share.